
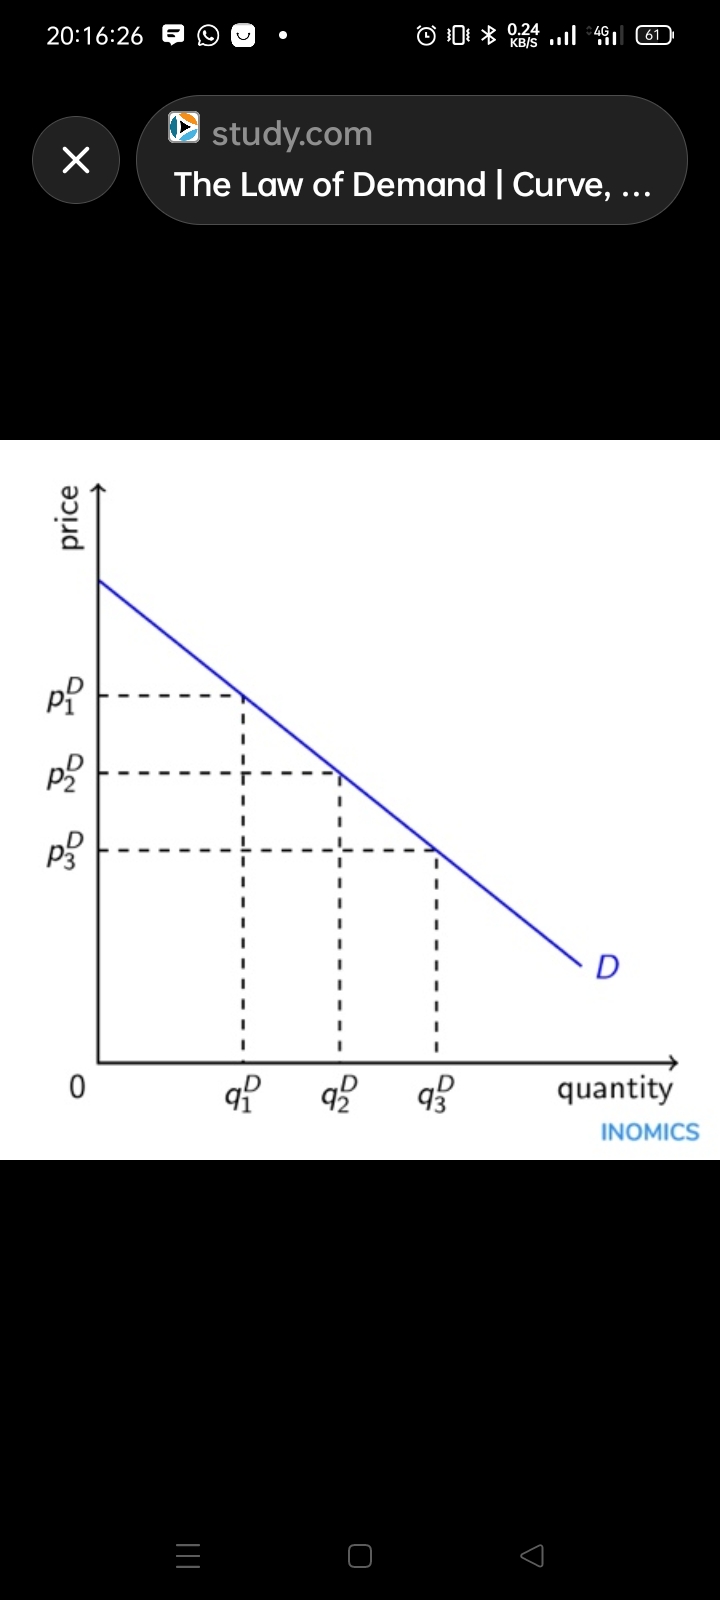
Downward sloping law of demand economics graph plotting price
By @jimmy5508 ·
Tags
- law of demand
- demand curve
- microeconomics
- economics graph
- price quantity relationship
- introductory economics
- economics education
- Inomics
- study.com
- economic theory
- business studies
- economics homework
- demand schedule
- learning resources
About this image
This clean minimal educational microeconomics diagram illustrates the law of demand, featuring a solid blue downward sloping demand line plotted on price and quantity axes. Dashed reference lines connect falling price points to corresponding rising quantity demanded values, showing the inverse relationship between price and consumer purchasing behavior. The simple uncluttered design is intended for introductory economics study and homework reference.
More from @jimmy5508
See all → Intricate circular sci-fi military portrait back tattoo on a shirtless tattooed man
 Wolverine and Deadpool stand heads pressed together in a dynamic comic style portrait
 Iron Man operating an industrial metal lathe in his gritty workshop lab
 Anime style armored sci-fi hero works on heavy machinery in a hazy industrial workshop
 Angry muscular green Incredible Hulk posing with clenched fists surrounded by floating shards of debris
 Close up of a gold Enfamil A+ Stage 1 infant formula tin for babies 0 to 6 months old
More like this
See all →


Made on BudgetPixel
The models and tools behind posts like this one.