
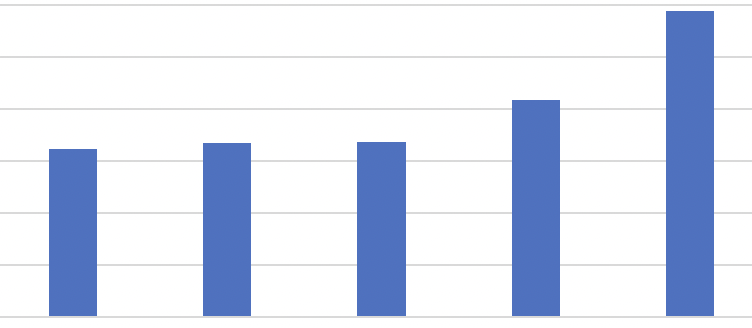
Vertical bar graph with five blue bars showing a clear upward trend
By @iylkl ·
lop
Tags
- bar graph
- data visualization
- upward trend
- business analytics
- performance metrics
- blue bar chart
- statistical graph
- data reporting
- infographic element
- increasing values
- financial chart
- presentation graphic
- minimalist design
- market trend
- quantitative data
About this image
This clean minimalist bar chart features solid slate blue vertical bars set against faint grey horizontal grid lines on a plain white background. The first three bars sit at roughly equal height, while the fourth and fifth bars increase steadily to show a consistent rising trend. The flat professional design is well suited for business reports, data presentations, and analytics visuals.
More from @iylkl
See all → Armored Whiterun guard holds a shield while standing on a cobblestone medieval town street from Skyrim
 Fluffy gray tabby cat creates a funny optical illusion of wearing a wide brim hat from a couch cushion
 Circular TTRPG token portrait of a mustached elf man leaning on a wooden walking staff
 Hypnotized goblin stares transfixed at a glowing green magic crystal he holds in a dark cave
 Bald pale muscular humanoid drinking on a rocky shore under overcast twilight skies
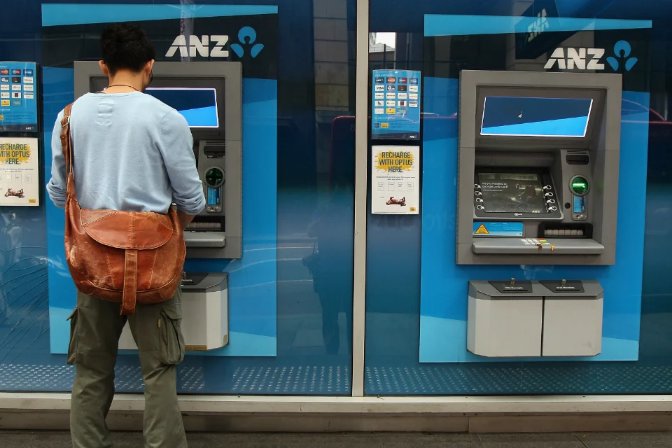 Man with a brown leather shoulder bag uses an outdoor ANZ ATM on a city sidewalk
More like this
See all →





Made on BudgetPixel
The models and tools behind posts like this one.
- SeeDream 5.0 Pro
- MiniMax H3 Image
- Seedream 5.5
- AI Image Generator
- AI Backyard Design Generator
- AI Bathroom Design Generator
Guide: NightCafe vs BudgetPixel (2026): Which Is Better for AI Artists?