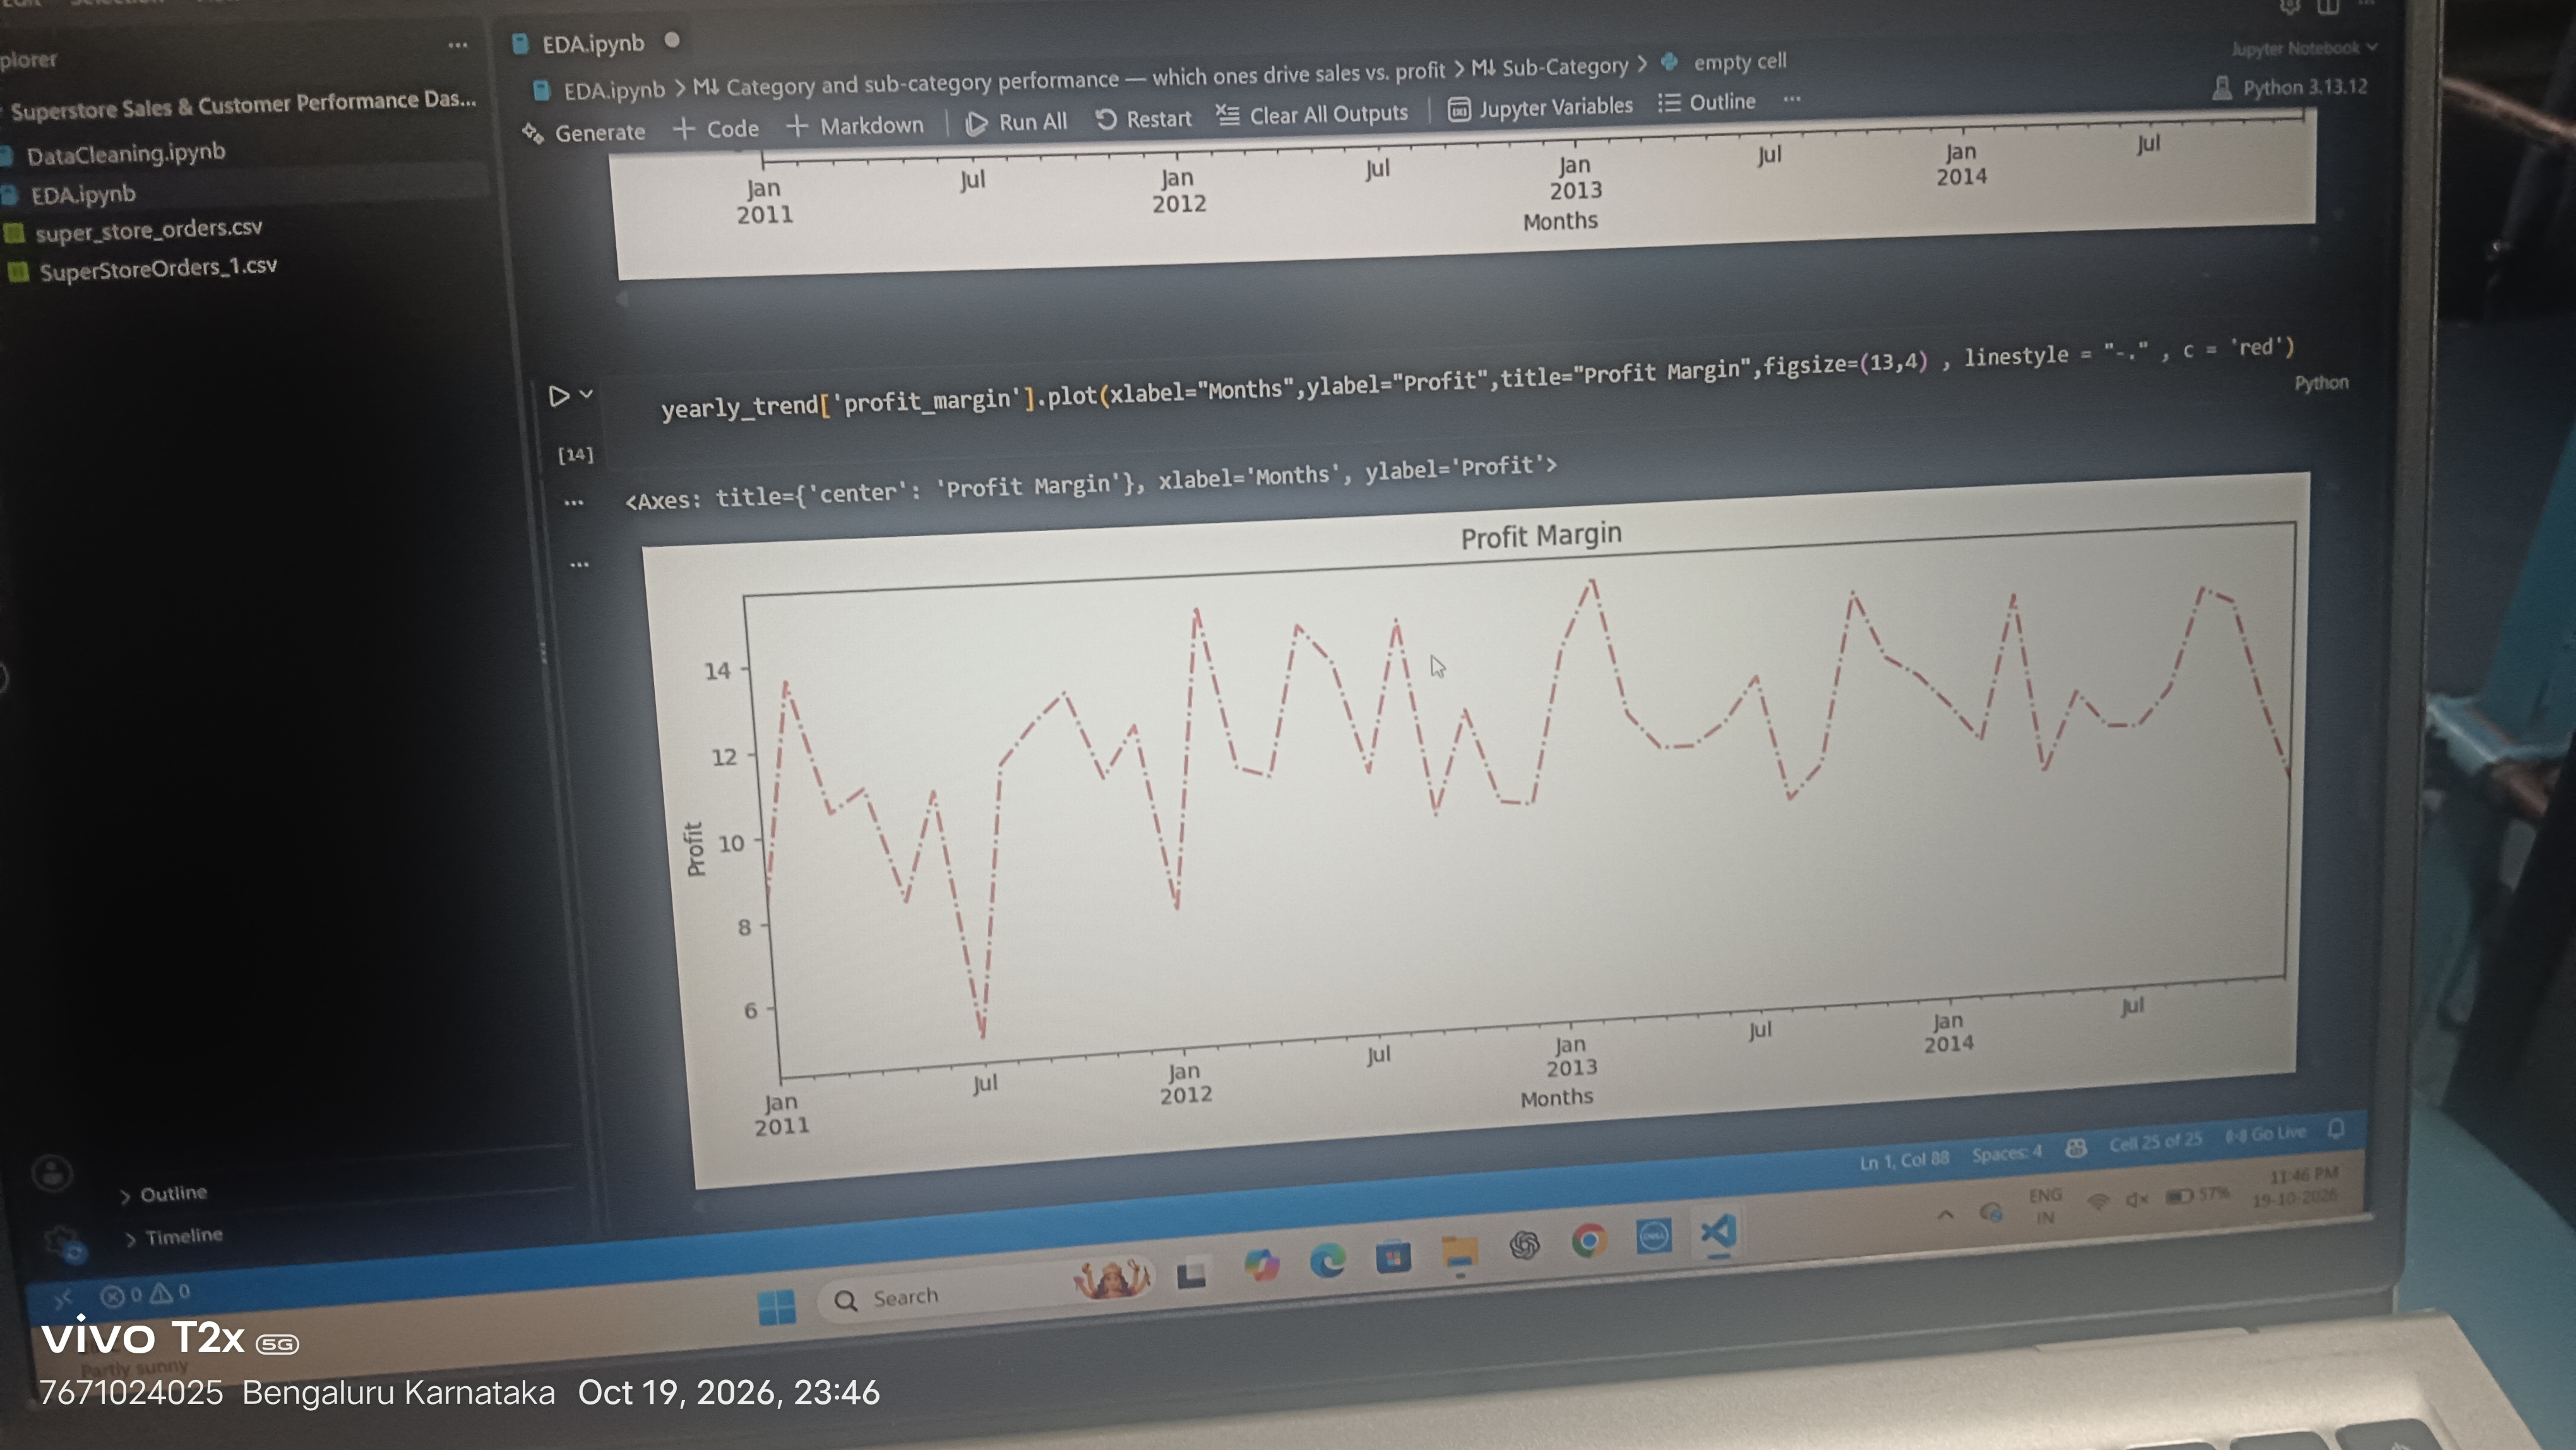
This photo captures a laptop display running a VS Code Jupyter Notebook for exploratory retail data analysis, showing Python matplotlib code that generates a dashed red line chart tracking monthly profit margin from 2011 to 2014. The dark IDE interface contrasts with the pale off-white plot area, which displays fluctuating profit trends across four years of superstore sales data. The shot shows an active data science workflow focused on business performance analytics and time series visualization.
Laptop screen showing a Jupyter Notebook with Python code — AI art by @hpi
@hpi · 10/20/2026
Hi
This photo captures a laptop display running a VS Code Jupyter Notebook for exploratory retail data analysis, showing Python matplotlib code that generates a dashed red line chart tracking monthly profit margin from 2011 to 2014. The dark IDE interface contrasts with the pale off-white plot area, which displays fluctuating profit trends across four years of superstore sales data. The shot shows an active data science workflow focused on business performance analytics and time series visualization.
Tags: Jupyter Notebook, Python programming, data science, exploratory data analysis, profit margin, matplotlib, time series plot, business analytics, sales performance, data visualization, VS Code, retail dataset, line chart, data analysis, coding