Linear fit graph plotting torque T against number of turns N from a physics lab experiment
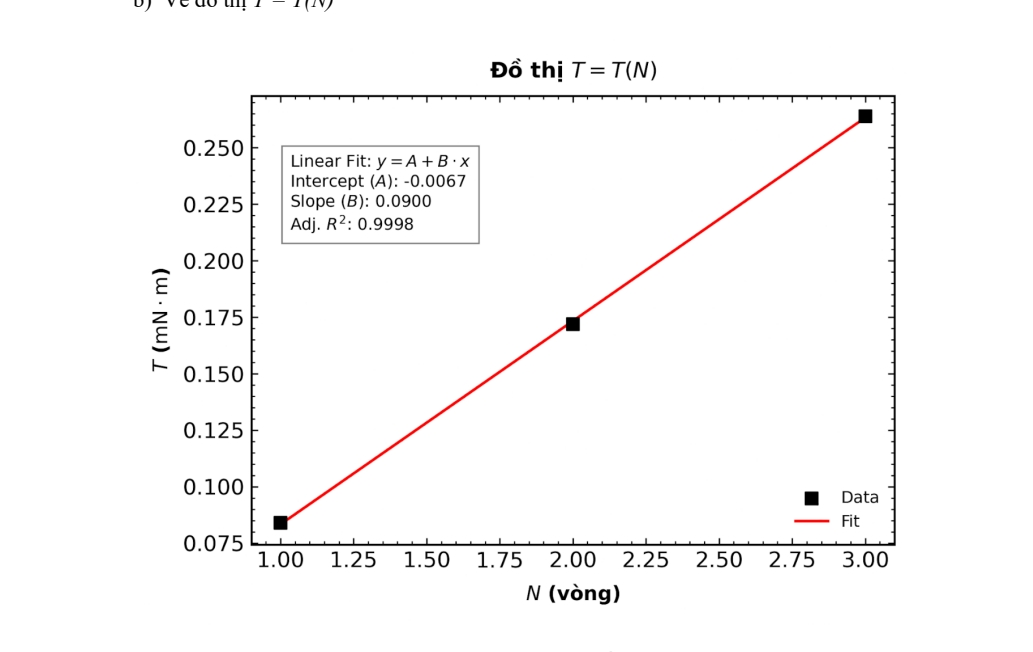
This clean minimal STEM graph displays experimental data as black square markers, paired with a solid red linear best fit line showing a strong positive correlation. It includes printed linear regression statistics with an adjusted R-squared value of 0.9998, indicating an almost perfect linear relationship between the plotted variables. Vietnamese title and axis labels mark this as an undergraduate physics lab results plot.

Linear fit graph plotting torque T against number of turns N — AI art by @juyk

@juyk · 9/28/2026
Linear fit graph plotting torque T against number of turns N from a physics lab experiment
This clean minimal STEM graph displays experimental data as black square markers, paired with a solid red linear best fit line showing a strong positive correlation. It includes printed linear regression statistics with an adjusted R-squared value of 0.9998, indicating an almost perfect linear relationship between the plotted variables. Vietnamese title and axis labels mark this as an undergraduate physics lab results plot.

Tags: linear regression, lab graph, physics experiment, torque vs turns, best fit line, experimental data, STEM education, data visualization, lab report, regression statistics, R squared value, mechanics lab, science chart, electromagnetism experiment, undergraduate physics

0